Preparing for the Future Now
Executive Summary
Google Analytics 4 (GA4) is a fundamental reinvention of the platform core: the GA4 property and the event-based measurement model. These two elements drive a flexible, user-centric data model, making a broad set of aligned functionalities possible and impactful:
- Discover and use accurate and comprehensive customer journeys cross-device and cross-platform without manually combining separate data elements
- Capture any user action as an event with brand-defined parameters that multiply value for every touchpoint
- Build out a reporting structure reflecting any element and activity of a business model and its customers, parsing data using any relevant dimension from the reporting UI
- Define custom audiences quickly, using any dimension, insight, even predictive metric
- Use machine learning to power the platform, predicting customer behavior, bridging data gaps, and driving insights
- Handle privacy realities smoothly by using a three-fold identity system, separate opt-in for measurement and targeting, automated retention periods, and user data deletion mechanisms
GA4’s “app+web” property and events-based measurement model simplifies digital analytics processes, creating an open-ended structure with universal building blocks that expands both breadth and depth of impact.
While GA3 UA (Universal Analytics) continues to be the analytics system of record for many brands for the remainder of 2022, inevitably GA4 will replace it for all of the reasons listed above. GA3 UA will sunset 6/30/23. As a result, no data will be recorded in the GA3 database as of 7/1/23. Any tracking that uses GA3 must be recreated in GA4 or another platform in order to be used after this time. Moreover, GA4 should be implemented as soon as possible in order to test in parallel.
Currently, no reasonable method exists to migrate GA3’s Universal Analytics (UA) configuration and data to a GA4 property and measurement schema--they are fundamentally different in structure, code, and approach.
Instead, the nearly universal guidance has been that brands implement GA4, and run GA3 and GA4 properties parallel until functionality improvements from Google and configuration builds by each brand combine to meet the business need. Arcalea recommends all orgs replicate necessary GA3 schema in GA4 and fully test before the end of calendar year 2022.
Brands that use the transition time wisely will be positioned to meet their future analytics needs more easily while developing the historical data required for predictive metrics, advanced insights, and ML-driven modeling not possible with GA3’s UA.
Brands can experiment with the new GA4 property and measurement model, replicating GA3 solutions and even improving them. By running parallel properties now, marketers can build a large volume of structured, relevant, historical data using a flexible model that will provide comparative data and a future resource for Artificial Intelligence (AI) and Machine Learning (ML). GA4 is the platform most suited for accomplishing future state goals. Meanwhile, the brand’s GA3 UA property will continue to collect meaningful data until GA4 replaces it entirely in June 2023.
Energizing Business with GA4
Shelly’s Eclipse Tea Delivery
The Business
Shelly started Eclipse Tea Delivery 5 years ago to offer specialty teas with separate B2C and B2B offerings:
- US consumers purchased directly from Eclipse Tea’s e-commerce site
- International businesses with US-based executive offices contracted with Eclipse Tea as a service provider for their US location.
Shelly grew the business from 4 to 15 employees, with a dedicated employee for each city (NYC, DC, LA) offering B2B service. Eclipse Tea depends on a wide net of referring sites at top of the funnel to reach an eclectic customer base (B2C/B2B mix, casual tea drinkers, tea aficionados, non-English corporate executives).
The Challenge
During 2020, specialty tea shops in US cities and international tea suppliers rapidly expanded digital efforts to compensate for decreased local sales. As a result, Eclipse Tea experienced double-digit decreases in revenue by mid-year. Shelly’s team needed to act quickly to gain or maintain market share.
The Response
Shelly’s team used predictive audiences and customer journey analysis to design effective audience-centric messaging.
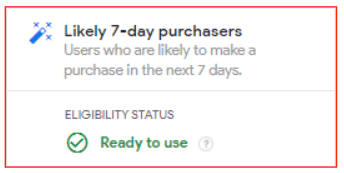
Custom predictive audiences: Shelly’s team created audience segments based on a high probability of near-term purchase, and, separately, the likelihood of large purchases in the coming month. These 2 audiences were further divided between the B2C and B2B segments
Analyzed customer journeys: While B2C and B2B customers both initiated purchases on the Eclipse Tea e-commerce site, identifying other journey touchpoints provided additional opportunities to reach both groups. B2C segment journeys revealed specific social media activity prior to purchase, while B2B journeys were more likely to visit local business journals in host cities, as well as specific online gourmet magazines.
Targeted messaging: Eclipse Tea addressed the B2C segment by increasing Facebook and Twitter custom messaging over the next 60 days. Display ads in journals were used to drive new B2B contracts, while local employees reached out directly to identifiable companies.
The Results
After 60 days, the loss was cut in half. Shelly’s team continued to run predictive reporting, create custom audiences, and tweak messaging, anticipating a net gain in revenue compared with pre-2020 levels within 120 days.
Why GA4 Now?
Google Analytics Model Shift
Previous Google Analytics
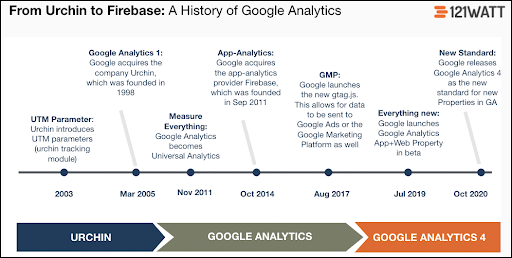
Since 2005 when Google Analytics was first launched, the platform has gone through many modifications, small and large. The launch itself was a landmark of sorts: a free enterprise analytics software so popular access had to be limited while Google built capacity. Then came years of updates: UI, APIs, custom reporting, Universal Analytics, new metrics, Google Tag Manager, attribution modeling, enhanced ecommerce features, even modified javascript libraries across the three prior versions.
While many of the changes were unique and beneficial, many were also simultaneously challenging to configure, and, as a result, underutilized.
However the recent change is less about adding features, or even an upgrade; instead, Google has in essence released a new product that changes the way marketers approach digital analytics.
User Experience
As Google’s VP of Engineering alluded to at launch, marketers today find that analytics platforms and solutions “make it difficult to get a complete view of the customer and derive insights,” one of the fundamental missions in the business (Srinivasan).
Increased Analytics Challenge
In the 15 years since the initial GA launch, this mission has become more complicated (and crowded), and the challenges have grown just like the internet, channels, and customer journey have grown and shifted in unique ways. Customers now visit a wide variety of websites as they move from interest to purchase, reading blog posts, social media recommendations, and often using a variety of devices during the journey. Privacy awareness (and actual regulations) translates into fewer identifiers connecting data to users. As a result, accurately understanding the customer journey or attributions is more difficult just as both increases in complexity.
A New Analytics Platform
Google Analytics 4 (GA4) is a giant step to align the platform with the purpose, creating, measuring, and understanding an accurate view of the customer journey (with all its variety and component pieces), and responding to it quickly. Two core features drive the change:
- A tracking tool that is platform and device neutral (allowing marketers to track and measure consistently across e-commerce sites, social media, mobile apps, using smartphones, tablets, laptops, desktops, etc.)
- An event-based measurement tool that is “event” neutral (allowing marketers to define and track any event they want to measure, whether it’s a spend value added to a cart on an e-commerce site or a high score reached in a mobile game)
Why the Major Overhaul from Google?
First, the digital landscape has changed fundamentally since 2005, but Google Analytics has not. Users continue to be frustrated and challenged in simply capturing a clear view of the customer journey. Second, given the low levels of satisfaction digital marketers have with analytics platforms, the software field is rich with competition. A quick web search will find a wide variety of tools and complete platforms that aim to meet the need in whole or in part. As the maker of a suite of free and paid digital advertising tools, Google has an interest in maintaining market share with a relevant (and leading) analytics platform.
Finally, the data privacy movement that has arisen as a response to a digitized world has driven significant international and state regulation. The General Data Protection Regulation (GDPR) is in full effect as of May 2018, and multiple state-level regulations, such as CCPA, continue to be implemented in the US. Common practices, such as collecting website cookies or other information without consent are illegal, and not a part of future technology roadmaps.
Key Drivers of New GA Approach
The current direction of change spans several key underlying goals: privacy-centric, user-centric, adaptable, and configurable. The new “app + web” property brings the focus back to the users, wherever they go regardless of the platform used to get there. The “event + parameter” measurement model is focused on the user activity or interaction–not the session containing actions. The reporting UI is no longer a large set of canned reports arranged by old business or finance categories, but by highly adjustable building blocks arranged by the user lifecycle. The identity model is predicated on the fact of missing data as cookies are increasingly restricted as a key identifiable tag.
The advantages of this set of underlying drivers translate to a platform that marketers can more easily use to answer key questions about their customers. Below are some of the most important functionalities of the new platform.
Note: Google often modifies functions during the life cycle of software, and slight variations were noticed between “late beta” and the post-October launch version. Users may find that as functions or features continue to appear, some will change or disappear altogether.
Quick Links
Event + Parameter Measurement Model
AI-enabled Insights and Predictive Metrics
Combined “app + web” Property
Cross-platform and cross-device functionality is the result of the new combined App + Web property (launched in Beta June 2019) that no longer requires separate management and configuration with Firebase and GA/UA, respectively.
In prior versions of GA, all web-based data is built upon sessions (which then collected page views). Google’s Firebase (a collection of mobile application tools) tracks app data built around events. If a marketer wanted to analyze a user’s path across both types of environments, there is no standard unit of measure applicable to both.
Now that the website and mobile app user activity are combined in one property, marketers no longer must combine data after tracking, merging unlike elements in an attempt to create a holistic picture of the customer journey. Add to this that web data is no longer in sessions and is now also events-based, and the ease of developing, tracking, and reporting across both realms has significantly refocused the analysis on the user
If a user begins the journey on social media, visits a brand’s main website landing page, and later downloads a white paper with a mobile app, all touchpoints are captured together to represent a continuous path. Marketers can much more easily identify the key interactions that lead to conversions and respond with targeted adjustments to marketing elements. A unified set of data points provides clear insights enabling decisions on where to advertise: for example, when to adjust a landing page, or create a specific social media messaging.
Because both app and web-property are one, the schema is shared, and allows consistency and ease in all aspects of a brand’s analysis, including reporting, events, and disparate customer journey analysis
The G4 property allows multiple data streams (data sources), with up to 50 data streams of web and app. With all property data streams sharing basic logic (events + parameters), and all being represented in one UI and reporting engine, there is virtually no limit to the complexity and richness of data used to create an accurate picture of a brand’s interactions with customers.
Event+Parameter Measurement Model
Universal Analytics
The new event-based measurement model focuses on user events defined by the business to match customer actions and activity for analysis. In Universal Analytics (UA), the primary tracking model was a hierarchical structure of pageviews tied to sessions. Everything happened or was attached to a session, and the primary tracked “event” was page views, which is of limited value for significant analysis. All other tracked events were manually set up in javascript, whether using the Google Tag Manager (GTM) system or directly adding tags with the gtag.js framework.
Everything is an Event
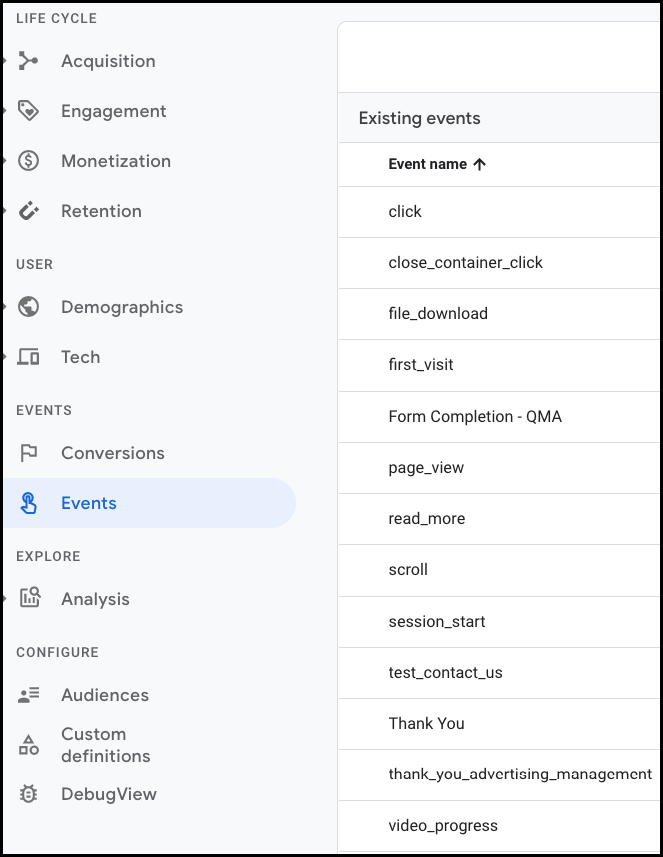
In contrast, the GA4 focuses on user actions. The GA4 property uses an event + parameter model for tracking all touchpoints and interactions, creating standardization across both websites and mobile apps, as any action can be defined as an event. The focus on user action instead of sessions creates a more user-centric approach and opens the configuration to track any user interaction with a platform- and device-neutral logic.
Configuring Events
Still, events must be configured and added to the tracked property. Rather than create a set of existing events and parameters, Google left the configuration and definition choices up to the marketer, who in turn can design sets of “event + parameters” that most match the needs of the business based on customers, business model, and analysis needs. Because the type of event (and the type of defining data captured by parameters) is highly situational, events defined for an ecommerce site might be irrelevant for a specific mobile app. Just as in GA4 reporting, allowing user-defined elements that match the need are preferable to irrelevant canned configurations.
Recommended Events
Google did, however, create recommended events. Grouped by different business types and sectors, Google created a list of recommended events and parameter names for GA4 users. For example, ecommerce events include add_to_cart with recommended parameters of currency, items, and value. For gaming, events include post_score with parameters of level, character, and score.
Enhanced Measurement
While there are no standard pre-configured events and parameters to edit across all business types, GA4 does include a set of automatically tracked general events on any website that has the GA4 property installed. Called “Enhanced Measurement” by Google, the auto tracked events are:
- Pageviews
- Scroll
- Outbound clicks
- Site search
- Video engagement
- File download
Each of these events is automatically tracked unless these events are disabled in GA4 (toggled in the UI). While these might not all be critical advantages, some, like outbound link and file download have significant use. Outbound click captures any link clicked that takes a user to another domain (if a brand operates across multiple domains, these can be added to not trigger an outbound click). A standard parameter for outbound click is link_URL to capture what the user clicked, enabling the data point for another dimension of analysis. File download events capture file_name and link_url, capturing the download and location. Any brand offering additional marketing content, such as e-books, white papers, etc., will capture these data points without any configuration or added events and parameters.
Custom Events
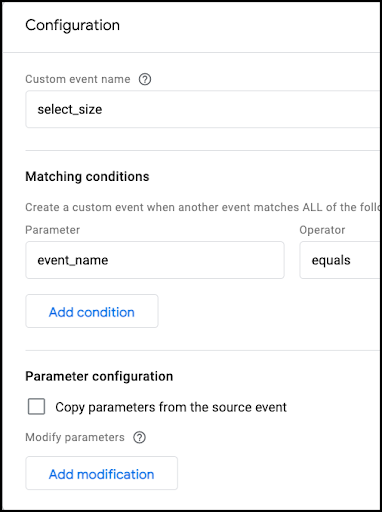
In addition to the recommended events, GA4 users can (and should) create custom events, defining names and parameters to match customer and business needs. In both cases, recommended and custom, marketers must create the events.
Repurposing Parameters
When creating events and parameters, marketers should remember that parameters can be repurposed across different events: the parameter “currency” can be used in the events begin_checkout, add_to_cart, refund, purchase, etc.; the parameter “items” can be used in the events view_cart, add_to_wishlist, add_payment_info, etc.
Planning for Future Events
Parameters (and custom parameters) are attached to an event to create data value, organize the data of the event into a mini “schema” and can be used across multiple events. As a result, marketers should consider their events and parameters with their analytics future in mind. Choosing a parameter structure and naming convention that can be used as building blocks across different tracking scenarios will create a clean approach that avoids unnecessary multiplication of parameters.
The shift to an event-based model is an overall new way of thinking about digital analytics: user-focused, events tied to customers instead of customers tied to sessions, customer-journey focused without manually aggregating lots of session data from multiple properties. The use of the core new event-based measurement model increases value across the analytics platform and each brand’s approach to digital analytics. The flexibility of the open-ended event model simplifies a consistent approach across analytics. The events and parameters can be treated as a dimension and used for segmenting, ad hoc comparison, and analysis across varied platforms.
Reporting
Regardless of a brand’s advanced tracking or gathering of relevant data, all of the data capture in the world is meaningless without reporting that can parse data volumes and present meaningful dimensions, metrics, and actionable insights. As many marketers discovered early in their careers, tracking everything but using little is an ineffective and frustrating waste/use of resources.
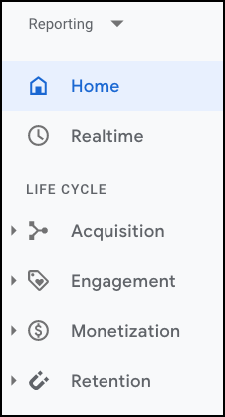
Reporting at First Glance
Marketers venturing into the reporting section will immediately note a different layout. Rather than a multi-tabbed report environment, the GA4 reports are aligned with the customer life cycle, each with an overview containing adjustable scorecards in which comparisons and dimensions can be added. Clicking a link at the bottom of these scorecards pops out to the larger relevant dataset. However, clicking into each life cycle section, GA3 users will immediately notice something else: a lot of “missing” reports.
Why Are Reports Missing?
Canned reports are not missing, but rather potentially irrelevant. Now that a new data model transcends platform, device, websites, and apps, GA3 reports no longer fit the approach driven by the dual app+web property and event-based measurement model. Moreover, the new building blocks of analytics created by the approach are more conducive to each brand creating a reporting set that perfectly aligns with the business model, positions the brand for the strategic roadmap, and contains only relevant data elements.
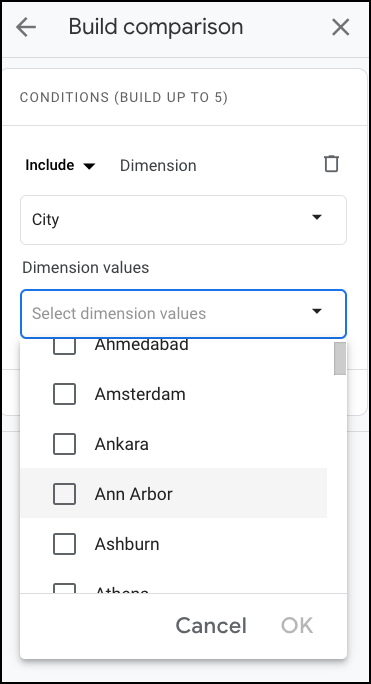
Because of the consistent logic of the event-based measurement model, and the dual app+web G4 property, building and configuring reports quickly becomes intuitive. Marketers no longer need workarounds to track unlike data objects or merge data from different platforms or properties. Audiences, events, and dimensions are simpler to create, compare, and analyze.
Within the reports themselves, marketers can easily add different dimensions and metrics to compare without leaving the report. Typing a reporting question in the search bar, users can zero in on the exact report and location for the answer, or link to an explanation to create reporting that provides the desired data points.
The reporting structure is both flexible and marketer-driven.
E-commerce Tracking and Reporting
While the preconfigured ecommerce reports are not available in GA4, all the data points and the reports they populated are simple to replicate in GA4. In fact, Google developers have already written tag examples to run parallel ecommerce tracking in G3/G4. Marketers can add events for any ecommerce related function needed for analysis, including add_to_cart, purchase, or any of the 15 recommended events per Google, or up to 500 custom events each brand defines. And for each event, up to 25 parameters can be defined to capture specific values for reporting and analysis using dozens of dimensions.
BigQuery
A feature once reserved for customers paying for GA360, BigQuery is a data warehouse allowing custom queries for large unsampled datasets. BigQuery data can be combined with other data sources for unique slicing and dicing previously unavailable outside of GA360. Because of the much more lenient thresholds for sampling in GA4, access to unsampled data is really only important outside of the standard reports, usually applying in Analysis Hub reports at higher volumes of data.
More importantly, data reporting limitations in GA4’s UI mean that any data beyond a limit cannot be accessed in GA4’s UI. However, the data is still captured, and BigQuery allows access to all captured data, regardless of GA4 limits.
AI-enabled Insights and Predictive Metrics
While Artificial Intelligence (AI) and Machine Learning (ML) have been a component of many Google platforms, including GA, the new platform includes new user-facing ML features that provide immediate value:
- Automated insights
- Powerful UI search field
- Predictive metrics
Business Intelligence: Predictive Revenue Modeling
Predictive Analytics: Predictive Revenue for Every Business Expertise in the performance drivers at each step ...
Automated Insights

Automated insights use algorithms to evaluate multiple data dimensions for significant anomalies and trends, and then automatically display these on the Home page or when Automated Insights are launched from the UI. These can be spikes in traffic within a specific channel, or drops in conversions, or even whether mobile devices have increased twice as much as desktops and tablets
Launching Automated Insights brings up a sidebar allowing users to type in a question or area for insights, and provides sample questions by topic areas (e.g., Demographics, Acquisition, etc.).
Users can also create Custom Insights by entering specific criteria to monitor: the segment, frequency, and metric along with the value for triggering an insight. In effect, marketers can quickly create monitors that evaluate complex thresholds that are critical to a campaign, audience, or targeted segment.
And each time a user interacts with an insight, AI learns which are most important to the brand and adjusts insight ranking for future insights.
Predictive Metrics

Predictive metrics use machine learning (ML) to predict future user behavior from the event data a marketer is already capturing
Currently, GA4 provides 3 types of predictive metrics:
- Purchase probability: the probability that a user active for the prior 28 days will complete a specific conversion within the next 7 days.
- Churn probability: the probability that a user active on a brand’s app or site within the last 7 days will not be active within the next 7 days.
- Revenue prediction: revenue expected from all purchase conversions within the next 28 days from a user who was active in the last 28 days.
Using predictive metrics in mass provides marketers with tremendous insights that can be activated to increase conversions, reduce churn, and maximize revenue. The brand can create predictive audiences resulting from the metrics: for example, an audience of all likely churns could be addressed with an automated marketing workflow; an audience likely to make a specific conversion could receive just-in-time information or a coupon; or for an audience of B2B large-ticket purchasers, a call from the Account Manager could close.
ML-based tools learn from the data and refine models based on the continued volume of structured event data collected. In some cases, minimum data thresholds are required for a property to be eligible. Google updates requirements and limitations within GA4 help for each feature (for example, see GA4 Predictive Metrics Prerequisites).
Search Bar
AI is also used in the GA4 main Search Bar, providing suggestions based on recent action, and providing immediate links to specific analytic data results.
Preparing for Machine Learning and Modeling
Finally, as Google stated at GA4’s launch, analytics must evolve with the technology landscape and “adapt to a future with or without cookies or identifiers.” One way GA4 will adapt and evolve is to “include modeling to fill in the gaps where the data may be incomplete” (Srinivasan).
In short, conversion modeling works by taking a large, contextually comprehensive volume of accurate historical data; then combines these learnings with current observable signals to model it across an active campaign. The model can accurately show conversions in the active campaign in spite of data gaps.
The power of machine learning works well with a consistent structure and framework in order to quickly learn and perfect models. This structured, large volume and relevant data will help predict key metrics and outcomes.
Google Ads Integration
Linked GA4 Data
GA4 properties can link to Google Ads accounts, connecting all GA4 audiences and conversions to Google Ads. In fact, linking GA4 to the Google Ads manager account makes all the data available to all Google Ads accounts.
The automated data collection from Enhanced Measurement is also available for Google Ads, providing outbound clicks, file downloads, and more across platforms and devices. Regardless of through which device and on what platform a customer journey begins, if the customer purchases using a different method, Google Ads will update so that improper retargeting does not occur. Marketers can see Google Ads conversions in the context of organic conversions and other paid-channel conversions, all in one view.
Conversion Data Value
Because the conversion-event data is now part of the brand’s Google Ads dataset, all of that data can be used for defining target audiences. And since each event can have up to 25 parameters (each value-loaded), marketers can use the parameter values to define audiences. Now audiences can be defined by any parameter marketers choose to attach to a conversion event: payment_value, items, coupon, affiliation, promotion, location, shipping, etc.
Audiences from Event Data
For example, a remarketing audience can be targeted by shipping cost and receive a free-shipping offer based on shipping costs of a certain value; audiences that have used a coupon in a prior conversion are likely receptive to a similar approach; specific affiliation purchases can group customers and allow a more custom offer based on affiliation characteristics. Text ads can be customized for specifically segmented audiences, allowing a group personalization powerful even in large segments.
Managing the Digital Advertising Ecosystem to Create Value
The Digital Advertising Ecosystem Digital advertising is the delivery of promotional materials through various online ...
Identity tracking
Addressing the issues of privacy and the demands of measurement, Google implemented a three-component identifier model to track users across devices and platforms while preparing for a future without cookies, or with an opt-in approach that sharply limits how identifying data is used.
While UA allowed multiple identifiers for tracking across platforms, it had no method of linking the data from separate identifiers, making deduplicating difficult. GA4, however, is able to unify and deduplicate actions and paths across devices and platforms, providing a more comprehensive reflection of the customer journey. GA4 uses 3 Identity Spaces:
- User ID: a marketer created ID (from a web form, CRM/CDP, etc.) added to GA4 that increases the ability to build cross-platform and device reporting
- Google Signals: if a user is signed into a Google account, the identifier assists in tracking the entire customer path across device and locations
- Device ID (sometimes called “Client ID”): based on the user’s cookies, Device ID was the sole native identifier for UA tracking
Because GA4 uses all three identifiers to link a user’s data regardless of device and path, a much more complete customer journey can be captured and analyzed without one user appearing to be different users.
Privacy
One of the drivers behind GA4 is the acknowledgment that the new privacy-centric online world has significant ramifications for digital marketing. The new identity tracking and future modeling are important responses for helping marketers deal with the loss of cookies now and in the future.
GA4 also assists brands in dealing with new requirements of regulations such as GDPR or CCPA. Now that opt-in consent is becoming standard, GA4 supports separating permissions to use data for measurement versus advertising. As a result, marketers might use personal information for better measurement results, while not opting to use the data for targeting.
Similarly, data retention options are changed, with a maximum period of 14 months, with automatic two-month retention for data elements of age, gender, and interest regardless of user settings. In addition, GA4 users can request Google delete data upon user demand. IP addresses are anonymized with the full IP address never written to disk.
Energizing Business with GA4: Planning
Shelly’s Eclipse Tea Delivery, Preparing for G4 Solutions
Shelly’s team at Eclipse delivery were able to respond quickly to revenue loss by implementing several new GA4 features, such as cross-platform and -device tracking, predictive analytics, and custom predictive audiences.
When the beta analytics property was released in June 2019, Shelly’s Marketing Analyst immediately began experimenting. As a result, he was ready to use features that directly responded to the current challenge.
What was Required?
Eclipse Tea began using a parallel UA/G4 property configuration even though the business had no app at the time. As a result:
- Eclipse Tea had sufficient data volume to do predictive metrics, running reports for predictive churn, conversion, and revenue projection
- Using the GA4 UI, results from predictive conversion and revenue were turned into audiences, then re-segmented by customer type
- Working from new and prior messaging, Eclipse Tea sent revised messaging targeting their audiences positions and expectations
- Once a cycle was completed, Shelly’s team continued to run the predictive reports each month, refining the process and messaging each time.
Closing
While the cross-platform and -device GA4 property and the new event-based measurement model are the core driving features of Google Analytics, all of the components are aligned and synergistic: the core structure drives a flexible reporting system, AI/ML functions perform better with a consistently structured data model, and the open-ended nature of the system makes a broad ecommerce and integration functionality possible.
Adopting GA4 now allows planning for a rapidly approaching future environment (e.g., data gaps, increased AI/ML integration). The new structure reinforces intentional data collection that drives strong analytics by knowing why specific data elements are tracked. Planning in advance allows a future-proofing of event and parameter definition by choosing events and associated values for today’s campaigns and a brand’s data science future.
Adopting GA4 helps in building an accurate, quality dataset that answers current questions, considers future questions, and provides the backbone of machine learning analysis for predictive analytics and addressing inevitable data gaps.
Launching parallel G3/G4 properties going forward provides the opportunity to begin gathering historical data and to begin experimenting with the new analytics as features continue to roll out over the next year.
Updated 4/25/2022
Recommended Reading
G2. (2021). Best Digital Analytics Software. https://www.g2.com/categories/digital-analytics
A good representative listing of digital analytics tools and platforms with reviews and customer ratings.
Gaeta, Vin. (2020). Google Analytics 4: Your Business Website Analytics Are Now Smarter. https://www.impactplus.com/blog/google-analytics-4-updates-business-website-data
A brief overview from the perspective of a GA3 user: how to handle the changes, and the value of the new or different functionality.
Holl, Alexander. (2020). Google Analytics 4: The New Google Analytics Property. Ryte Magazine. https://en.ryte.com/magazine/google-analytics-4
A good overview covering the high points and then some: history, advantages, features, basic setup, reports, etc. Examples and illustrations included.
Matchett, Abby. (2020). Get the Most out of your Reporting with GA4 Properties. https://www.bounteous.com/insights/2020/04/01/reporting-google-analytics-google-analytics-4-properties/
Based on the beta “app+web” property, the article breaks down the report section, along with basic configurations.
McDonnell, Philip. (2020). Why Conversion Modeling Will be Crucial in a World without Cookies. https://www.thinkwithgoogle.com/marketing-strategies/data-and-measurement/conversion-measurement-in-a-cookieless-world/.
Google’s Director of Product Management describes conversion modeling at a conceptual level. A short read for understanding the basic concept, how it works, and why it’s necessary.
Spinnaker. (2020). Google Analytics 4: This is Why You Need to Look at the New Google Analytics, even if it’s in Beta. https://spinnakernordic.com/en/ga4/
Brief Danish introduction to GA4 just as it launched out of Beta. Spinnaker creates a balanced high-level approach for considering how GA4 should fit into marketers’ plans.
Srinivasan, Vidhya. (2020. Introducing the New Google Analytics. https://blog.google/products/marketingplatform/analytics/new_google_analytics/
Posted to coincide with G4’s launch, Google’s VP of Engineering, Google Ads, lays out how G4 fits in the current analytics ecosystem, and the main ideas driving the new release.
RELATED ARTICLES
-
Digital Advertising after Third-Party Cookiesread more
As privacy concerns grow, online advertisers should find alternatives to third-party cookies. Learn…
Online Advertising -
Testing and Experimentation in the Digital Marketplaceread more
Building a Foundation for Optimization and Innovation. The Rise of Digital Tests and Experiments.…
Online Advertising -
Calculating Lifetime Value (LTV)read more
In recent years, Customer Lifetime Value (LTV) has been described in an array of guiding articles…
Quantitative Marketing


